We Back Tested Our Own Score. Here's What We Found — Including What Didn't Work.
Most rating sites never test their own ratings. We recomputed 6,013 historical scores and measured what happened next. The results — and the honest caveats.
Every crypto rating site makes the same implicit promise: higher-rated coins should do better. Almost none of them ever check. We did — on our own score, after locking it so we couldn't quietly fix what we didn't like.
The setup
On July 2, 2026 we froze Clever Score v1.0 — all 30 factors, every threshold, every weight. Then we went back in time. We recomputed scores at 36 monthly dates from May 2023 through April 2026, across 281 coins, using only data knowable at each date. No peeking. That produced 6,013 coin-month observations. For each one, we asked a single question: over the next 90 days, did this coin beat Bitcoin?
Beating BTC is a deliberately brutal benchmark. Bitcoin outperformed the vast majority of altcoins over this period — a coin picked at random beat it only about a third of the time. So the test isn't "did high scorers go up." It's "did high scorers clear the hardest bar in crypto more often than low scorers."
What we found
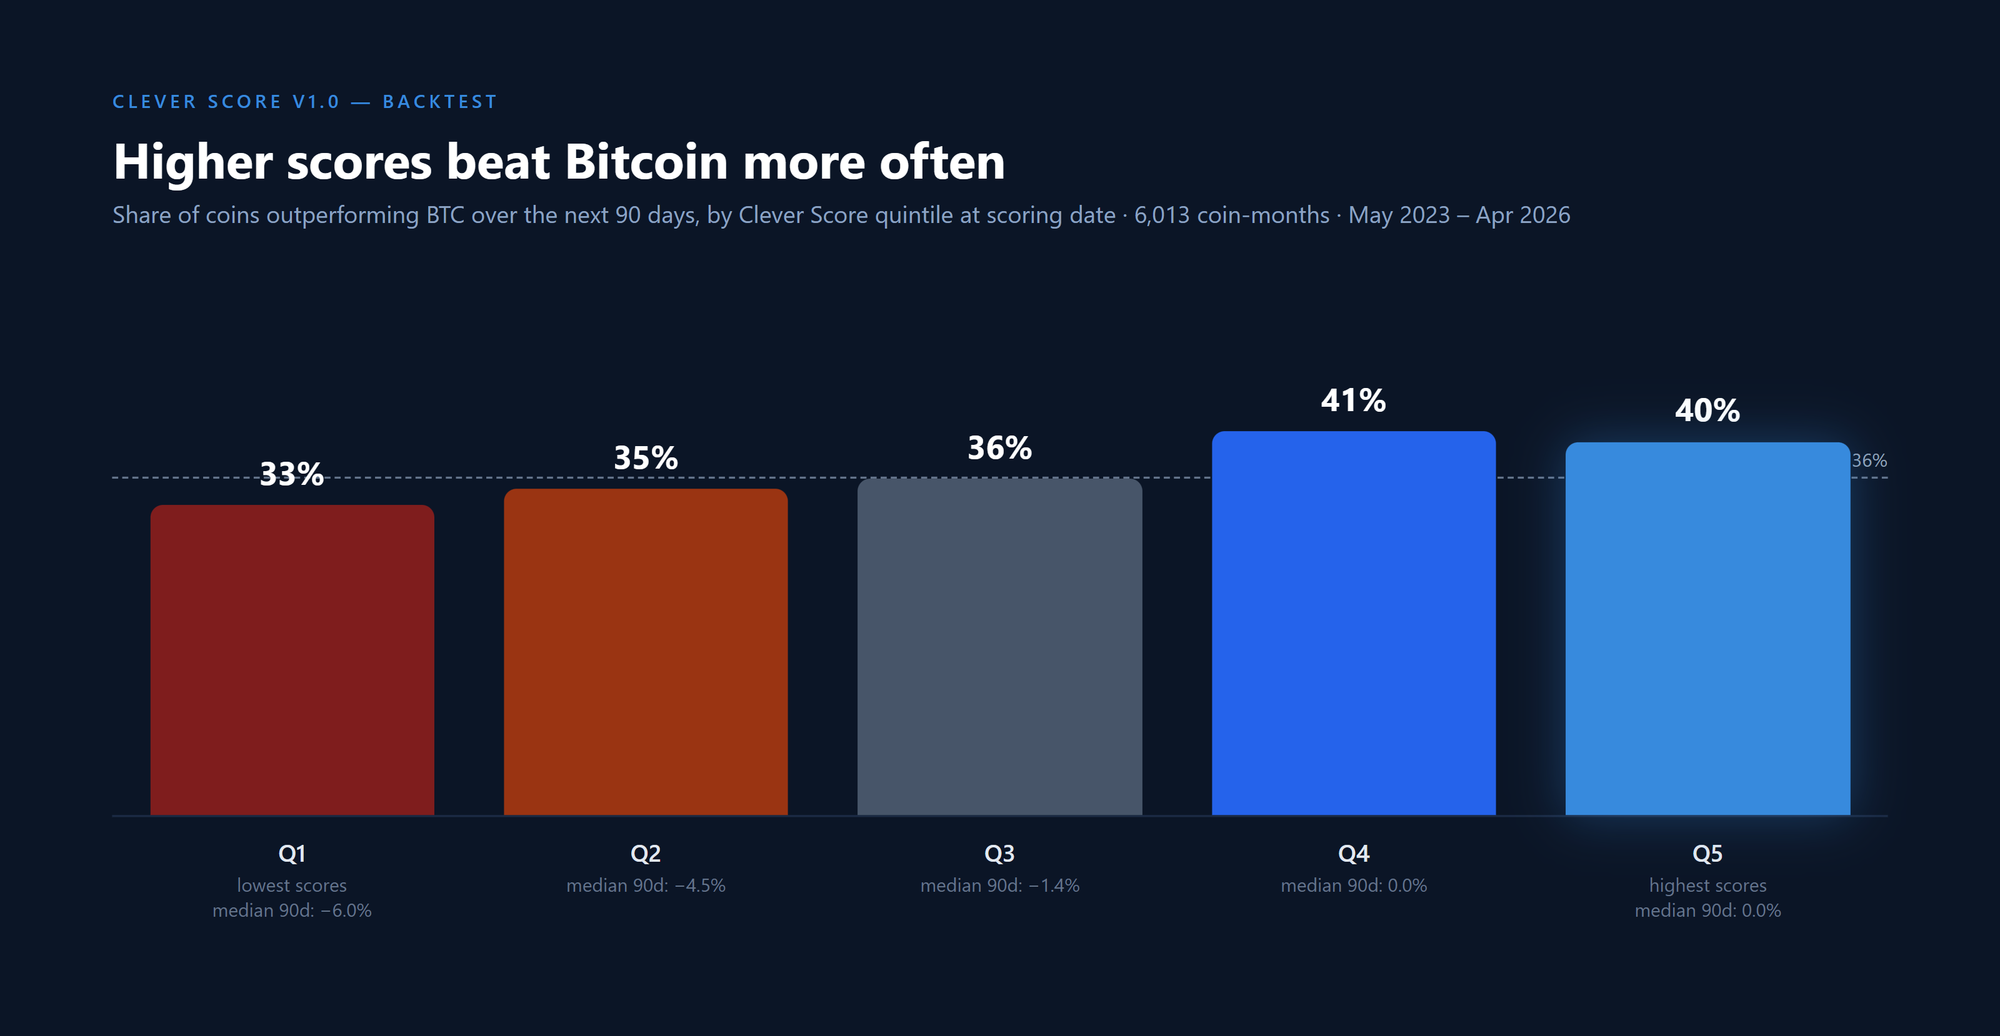
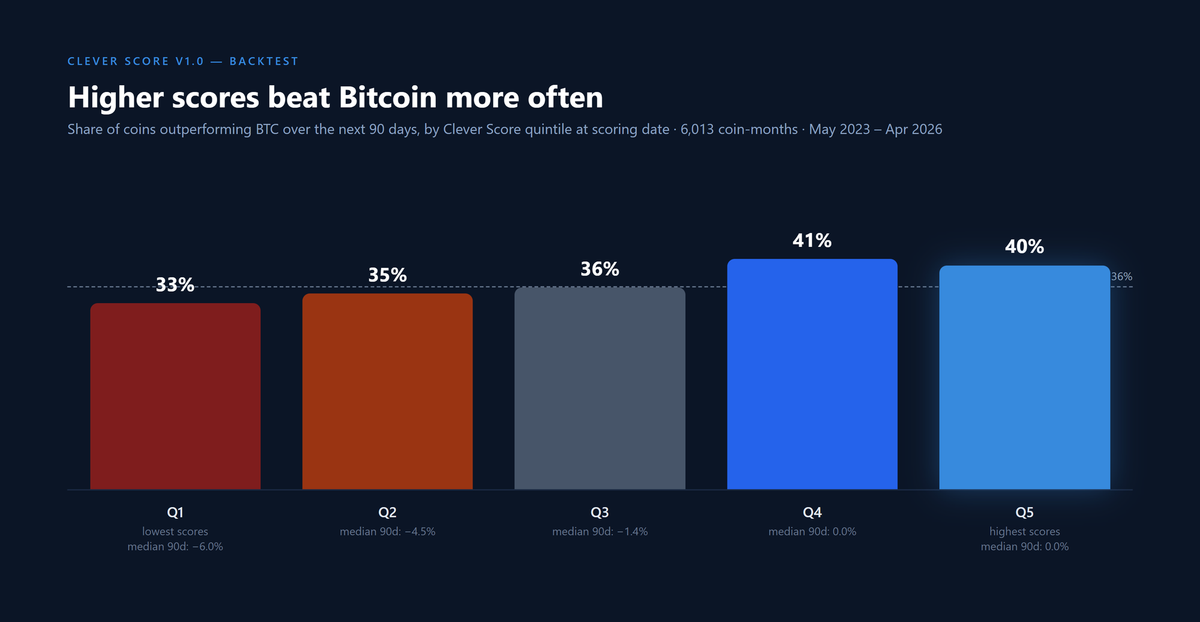
We split every scoring date's coins into quintiles — Q1 the lowest-scoring fifth, Q5 the highest — and measured forward returns.
| Score quintile at scoring date | Beat BTC over next 90d | Median 90d return |
|---|---|---|
| Q1 (lowest scores) | 33% | −6.0% |
| Q2 | 35% | −4.5% |
| Q3 | 36% | −1.4% |
| Q4 | 41% | 0.0% |
| Q5 (highest scores) | 40% | 0.0% |
Two things stand out.
First, the ranking works in the right direction: the odds of beating Bitcoin climb steadily from 33% in Q1 to 40–41% in Q4/Q5. That gap — roughly 8 percentage points — compounds meaningfully when you're making many decisions over many months.
Second, and more important: look at the medians. The typical low-scoring coin lost 6% over 90 days — in a period when crypto broadly went up. Low scorers are lottery tickets: a few moonshots, a long tail of steady losers. The typical high scorer roughly held its ground against the hardest benchmark in the asset class. The Clever Score's clearest edge isn't finding you the next 100x — it's keeping you out of the coins that quietly bleed.
It works better when markets are sane
Splitting by regime tells an honest story. In the 2024 memecoin mania, scores mattered least — when everything with a dog logo is up 400%, fundamentals are noise. In the 2025–26 market, the cleanest period, Q5 coins beat Bitcoin 48–50% of the time versus roughly 31% for Q1. The more the market rewards quality, the harder the score works.
What this backtest can't tell you
We'd rather you hear the limitations from us:
- Partial factor coverage. Only 13 of the 30 factors can be recomputed from historical price and volume data. The other 17 (on-chain, developer, whale data) use provider history that doesn't exist retroactively — the backtest treats them as missing, exactly as the live engine treats missing data. The live score has more information than the backtested one, not less.
- Survivorship bias. The universe is coins that exist today, so dead coins are underrepresented. Since dead coins tend to score badly on the way down, this likely understates the gap between quintiles — but we can't prove that, so we just disclose it.
- Three years is one market cycle. Regimes change. Backtested performance is not a guarantee of future results, and the Clever Score is a research tool, not financial advice.
Why we published this anyway
Because a scoring product that won't test itself is asking you to buy faith. We locked the methodology, ran the test, and published the misses along with the hits. Every future version of the score will get the same treatment — new version, new backtest, numbers in public.
The full factor list, scoring thresholds, and this backtest live permanently on our methodology page. Or skip ahead and see today's scores for all 1,000 coins — launch the app.